Of The Week: Is Bullying Endemic To The Profession?")


For many years, the overarching narrative for annual giving in higher education fundraising has been the same: We’re getting bigger gifts from fewer donors.
I hear myself repeating something similar when I host an annual webinar on emerging data trends for higher ed annual giving programs. With my co-host, Brian Kish, we pour over data from Blackbaud’s donorCentrics® and Fundraiser Performance Management™. And it seems that no matter what we do, there are fewer donors year over year. This monotonous narrative is causing fundraisers to be uninspired (a little dejected, even) which is not serving our programs.
This year, we felt it was important for us to start a conversation with fundraisers—especially annual giving professionals—about how we tell our annual giving story to stakeholders, and in particular to our bosses. Here’s what we suggest: We need to start rethinking annual giving metrics to create a new storyline about fundraising for higher education.
“Fewer Donors” Is Merely the Prologue to the Storyline
If the specific data is only subtly different year-over-year, maybe that’s not the full story. Maybe the story lies in how we measure success, how we improve the health of our annual giving programs. Maybe we need to focus our attention on narrower metrics. This will show better results in our current reporting and it will drive healthier results as we move forward.
This isn’t about making ourselves (and our bosses) feel better by weaving a rosier account than the numbers support. This is about looking at the numbers in a new way. It’s about reshaping the redundant tale of “fewer donors” into a compelling account of how a scrappy higher ed annual giving team can turn the tide on status quo fundraising.
Fluff Donors Could Be Affecting Your Narrative
Instead of assuming that lower donor counts are always bad, let’s consider a different possibility: Higher donor counts in years past might have been historically padded with “fluff” donors who might be artificially inflating donor counts. Here are two explanations.
- Dubious alumni support: While we no longer need to worry ourselves with the now-retired U.S. News & World Report metric of alumni participation, the impact of this ranking indicator is going to show in our data for years. The original spirit of that measure made sense: Our alumni support us! But having it as a ranking measurement pushed programs in the direction of gimmicks for participation points. Donor counts were higher, but it wasn’t a measure of donors with true philanthropic intent.
I think of it as equivalent to impulse buying at the grocery store. Even when I am shopping strictly for priority items, staples like eggs and bread, there are items I toss in my cart because they catch my eye in the moment: candy bars, coconut lip balm, etc. In the same way, the pressure of alumni participation goals in the past filled our data with a bunch of “in the moment” donors, not the “staples.” If one of our campaigns happened to catch an alumnus’ eye on a day when they felt they could give, they did. We might catch their philanthropic eye again sometime, but it isn’t mindful behavior on their part and it’s a not a strategic approach to alumni fundraising on our part. - Modern direct marketing methods: The growth in nonprofits (there are nearly 2 million nonprofits vying for donor attention and dollars) and the sophistication of our direct marketing efforts is forcing even lower-level donors to make more intentional philanthropic choices. This can reduce donor counts.
I always use my parents as an example: If they had $100 to give philanthropically, 20 years ago they would have given $5 to 20 organizations. As a result, they got their names and addresses on several organizations’ mailing lists. Those mailing lists have been sold and passed around. Now, 20 years of innovation in direct marketing later, their mailbox and inbox are stuffed with solicitations.
So, they must make choices now. Instead of giving to every veteran’s organization that asks them for a contribution, they have chosen one. And that one gets a bigger gift. Same with cancer research organizations: They choose just one. As a result, they are now lapsed donors on many organizations’ lists, but they are higher-level (and retained) donors on the chosen few.
How Can a $100 Gift Change Your Annual Giving Storyline?
If we allow for the hypothesis that donor counts of yore were inflated because we were chasing quantity, it begs us to consider the “quality” of donors. What makes a quality donor and how do we measure it? As a starting point, it would be ideal to know which donors consider our organization one of their top philanthropic priorities.
And then there is capacity. Since donors have different capacities, it is challenging to consider gift threshold as a measure. For example, there might be a donor making a $25 gift that is their largest gift that year. Conversely, there might be a $10K donor for whom $1K is a small gift relative to their other philanthropy.
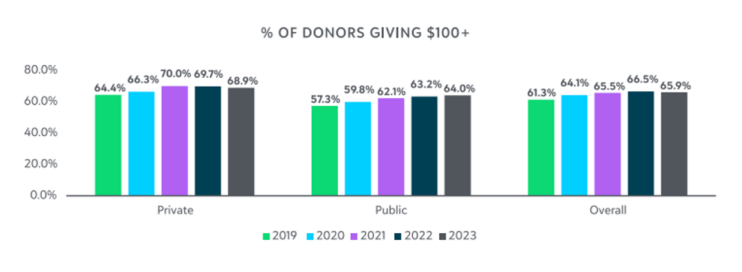
Even so, gift thresholds can serve as a good gauge for donors who might move up the pipeline. Data from the Fundraiser Performance Management community suggests that the median amount of an annual gift is $100. This means half of annual gifts are lower than that and half are higher. If we focus on donors at $100 and above, we are focusing on those most likely to retain and those most likely to move up the pipeline: 23% of small donors ($101-$500) are retained compared to only 10% of micro-donors ($1-$100) and, according to the Fundraising Effectiveness Survey for the first quarter of 2024, retention increases as gift size increases.
*Source of all charts: 2023 donorCentrics Annual Report on Higher Education Alumni Giving
Which leads us back to using the very data trends we have been struggling against to tell a different (more useful) annual giving story. We recommend you begin using new metrics to report on donors assuming we’re in agreement on the following two points:
- Not all donors are of the same “quality”
- Choosing a giving threshold like $100 can serve as a gauge for retention and upgrade
Agreed? Good! We especially recommend that you report on metrics that give more focus to quality donors, concentrating on the following data points:
- Number of annual giving donors at $100 and higher
- Annual giving donor retention of donors giving $100 and higher
- Measure $100 and higher donors who stay at that gift level
- Measure those who downgrade (but still give)
- Gift band migration: Are we feeding the pipeline?
Your Annual Donors Are the Heroes of Your Story
As you begin to emphasize “atypical” annual giving data points, is there still value in reporting on the classics? Absolutely: Tried-and-true data helps you provide a more balanced narrative, so keep standard metrics in mind, too:
- Amount of overall annual giving dollars
- Number of overall annual giving donors
- Overall annual giving retention rate
This approach isn’t just about the metrics. It is about how we use the metrics to tell the annual giving story. Vice presidents of advancement may not appreciate the nuance and value of annual giving. They might not perceive the story hidden in the data—a truly heroic tale of supporters who give what they can in service to your school. They might only notice that overall donor counts are down. And that will cause angst.
If you as an AG professional start to highlight the donor count of quality donors giving $100 and more, it will likely calm their angst (and yours), and you’ll begin rewriting the annual giving storyline with a better, brighter ending.
#Storyline #Higher