
To help major gift officers focus on donors instead of desk work, The Salvation Army Southern Territory has begun using Microsoft Power BI to build powerful dashboards for the organization’s major giving program.
With 45 major gift officers and 26 planned giving officers—spanning from Maryland to Florida, west to Oklahoma and Texas—The Salvation Army needed to streamline workflows and improve lead generation for specific gift types and gift levels. By extending the power of its Blackbaud CRM™ platform with Power BI, the team now sees more focused information about their major giving prospects.
What Is Microsoft Power BI?
A suite of tools, apps, and connectors that helps transform disconnected data into clear, engaging, and interactive visuals, Power BI allows you to pull from an open data source—could be from an Excel spreadsheet or a cloud-based CRM system or a federal database—so you can more easily aggregate, visualize, and interpret your data. This allows you to identify key insights and share them with your fundraising team or stakeholders with much less effort than pulling reports manually.
How Nonprofits Are Using Power BI
Nonprofit organizations and educational institutions often work with data from multiple sources. Power BI can help organizations translate complex data into an action plan for every team, from the finance office to fundraising. Here are some useful Power BI projects for nonprofits:
- Creating program effectiveness reports
- Developing donor activity reports
- Identifying revenue trends
- Forecasting
- Collecting, organizing, and analyzing data from outside sources, such as government studies
- Creating scenario planning
- Managing prospect portfolios
- Data modeling
Implementing Power BI at The Salvation Army
Founded in 1865, The Salvation Army has 1.8 million members and serves more than 27 million people in 134 countries. The organization offers support and aid in natural disasters and also provides ongoing community programs to address issues such as homelessness and food insecurity.
Tim McCleary, CRM Director for The Salvation Army Southern Territory, said the organization’s 71 major and planned giving officers have portfolios assigned by geographic region across 15 states. Their collective annual goal is $112.5 million.
“One of the benefits of the Power BI platform is to be able to drill down at any level within the organization,” McCleary said. “We can see how we’re doing from a territorial perspective, a command, a specific division, or an individual.”
Pain Points Addressed by Power BI
With such a large fundraising team and a massive database, The Salvation Army faced three main challenges that led them to adopt Power BI tools.
- Logging the work: Fundraisers needed a foolproof way to document and share what they’re doing and where.
- Manageable portfolio size: In the past, fundraisers would have up to 500 members in their portfolios, which is too unwieldy for them to give adequate attention to top major giving prospects.
- Deeper use of technology: Fundraisers needed to leverage analytics in a lead-generation tool, without overcomplicating the technology.
Building a Power BI Project
Before adopting Power BI tools to help the major giving team, The Salvation Army worked with Blackbaud to develop predictive model scores based on likelihood to give and other criteria.
- Principal Giving: Identifies the wealthiest prospects already in The Salvation Army’s database who are making very large gifts to other organizations; each is assigned to one of four likelihood tiers, ranging from $100,000 to $750,000 or more.
- Major Giving: Identifies prospects with a likelihood score up to $100,000, but who are not principal giving prospects.
- Planned Giving: Includes everyone in the database, pinpointing likelihood for annuity giving, bequests, Donor Advised Funds (DAFs), and charitable remainder trusts.
Lawrence Henze, Blackbaud senior principal analytics architect, said The Salvation Army also applies Affluence Insight™, which uses past giving and spending combined with sociodemographic data to predict wealth characteristics and philanthropic affinity. Using these analytics tools, The Salvation Army has identified more than 150,000 prospects for midlevel and major giving and 30,000 for principal giving.
“You want to know if they have the potential to be a philanthropist or if they’re just a casual donor,” Henze said. “Our concept of philanthropist is generally people who make annual gifts of at least five figures.”
On the other hand, casual donors pop up in your database every year or so. Henze said they may not warrant the time and marketing effort of a major gift officer.
The Power BI Lead Generation Dashboard
With donor tiers, analytics, and a robust database in place, McCleary was ready to see what he could do with Power BI. His goal was to create a lead generation tool to marry predictive analytics from external sources with internal metrics such as giving history to The Salvation Army to help major gift officers identify best-fit prospects.
What did McCleary’s team build? An easy-to-use dashboard. It is a lead generation tool that provides fundraisers a way to filter prospects with search criteria.
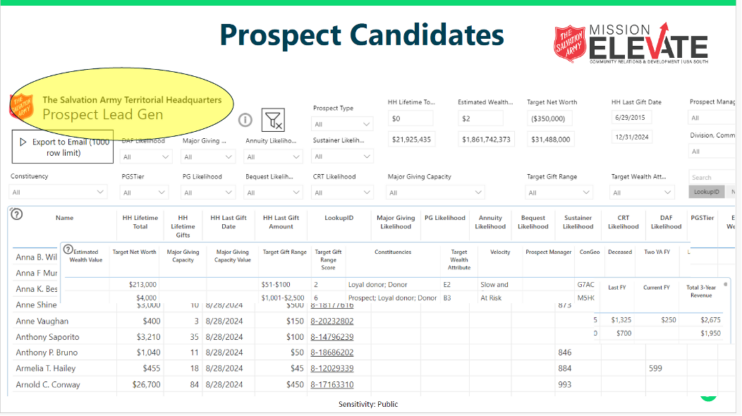
“If you choose, for instance, to look at the Principal Giving Score, you will see donors who have the potential to give us a six-figure gift,” McCleary said.
Fundraisers can then apply more filters to find donors based on additional criteria, such as:
- Giving history with The Salvation Army
- Donors with DAFs
- Recent increase in giving velocity
“This gives us a way to make some objective decisions about where we should focus our time and energy,” McCleary said.
Input from Staff Members
The goal of adding Power BI tools for lead generation was to simplify prospect identification and portfolio management, without requiring users to be geniuses of software integration. They can dive deep or they can use it for at-a-glance info.
“We want to make technology easier to use for our staff and more efficient and effective,” McCleary said. “We have a lot of technophobes in our user base. They can look at the lead gen dashboard to their heart’s content. They can’t break anything.”
McCleary relied on a group of beta users to test out the dashboard. He added filters and fields based on their recommendations, including a new integration with their email system so there is connection and communication between event calendars and each fundraiser’s prospect plan. Next will be a roadmap tool to plan out prospect visits for more efficient travel across the territory.
“We have built a pretty complicated dashboard, but from the viewing and using perspective, it’s very simple,” McCleary said. “It’s just filtering data to a user’s specific commands and their specific role.”
Advice for Adopting Power BI Tools
McCleary said nonprofit organizations experimenting with Power BI tools should expect their extensibility and integration projects to change over time. It’s likely you’ll create multiple iterations of your project as you incorporate user feedback. The Salvation Army created six versions of the lead gen dashboard its team is now using. They started, in fact, with a revenue project and worked their way up to the more complex dashboard for major giving. Connecting with other Power BI users helped the team as they experimented.
“This has been a great tool for us,” McCleary said. “We knew that it would be evolving over time. The power of Power BI platforms is really impressive. You can do so many things with it, it’s more a matter of what shouldn’t you do so you don’t make it too complicated or visually crowded.”
Want to learn more? Watch the free webinar, Using Power BI and Predictive Analytics to Optimize Major Giving Operations.
#Salvation #Army #Power #Boost #Major #Giving